Significance testing
Theory - Significance testing
Theory 1 - Significance testing
Significance test
Ingredients of a significance test (unary hypothesis test):
- — Null hypothesis event
- Identify a Claim
- Then: is background assumption (supposing Claim isn’t known)
- Goal is to invalidate in favor of Claim
- — Rejection Region event (decision rule)
- is written in terms of decision statistic and significance level
- is unlikely assuming . is more likely if Claim
- “If falls in , this Test rejects .”
- — Able to compute this
- Usually: inferred from or
- Adjust to achieve
Significance level
Suppose we are given a null hypothesis and a rejection region .
The significance level of is:
Sometimes the condition is dropped and we write , e.g. when a background model without assuming is not known.
Null hypothesis implies a distribution
Usually is unspecified, yet determines a known distribution.
In this case will not take the form of an event in a sample space, .
At a minimum, must determine .
We do NOT need these details:
- Background sample space
- Non-conditional distribution (full model): or
- Complement conditionals: or
In basic statistical inference theory, there are two kinds of error.
- Type I error concludes with rejecting when is true.
- Type II error concludes with maintaining when is false.
Type I error is usually a bigger problem. We want to consider as “innocent until proven guilty.”
is true is false Maintain null hypothesis Made right call Wrong acceptance Reject null hypothesis Wrong rejection Made right call
To design a significance test at , we must identify , and specify with the property that .
When is written using a variable , we must choose between:
Link to original
- One-tail rejection region: with or with
- Two-tail rejection region: with
Illustration
Example - One-tail test: Weighted die
One-tail test: Weighted die
Your friend gives you a single regular die, and say she is worried that it has been weighted to prefer the outcome of 2. She wants you to test it.
Design a significance test for the data of 20 rolls of the die to determine whether the die is weighted. Use significance level .
Solution
Let count the number of 2s that come up.
The Claim: “the die is weighted to prefer 2”
The null hypothesis : “the die is normal”Assuming is true, then , and therefore:
⚠️ Notice that “prefer 2” implies the claim is for more 2s than normal.
Therefore: Choose a one-tail rejection region.
Need such that:
Solve for by computing conditional CDF values:
0 1 2 3 4 5 6 7 0.026 0.130 0.329 0.567 0.769 0.898 0.963 0.989 Therefore, choose :
, but . Final answer:
Link to original
Two-tail test: Circuit voltage
Two-tail test: Circuit voltage
A boosted AC circuit is supposed to maintain an average voltage of with a standard deviation of . Nothing else is known about the voltage distribution.
Design a two-tail test incorporating the data of 40 independent measurements to determine if the expected value of the voltage is truly . Use .
Solution
Use as the decision statistic, i.e. the sample mean of 40 measurements of .
The Claim to test:
The null hypothesis :
Rejection region:
where is chosen so that
Assuming , we expect that:
Recall Chebyshev’s inequality:
Now solve:
Therefore the rejection region should be:
Link to original
One-tail test with a Gaussian: Weight loss drug
One-tail test with a Gaussian: Weight loss drug
Assume that in the background population in a specific demographic, the distribution of a person’s weight satisfies . Suppose that a pharmaceutical company has developed a weight-loss drug and plans to test it on a group of 64 individuals.
Design a test at the significance level to determine whether the drug is effective.
Solution
Since the drug is tested on 64 individuals, we use the sample mean as the decision statistic.
The Claim: “the drug is effective in reducing weight”
The null hypothesis : “no effect: weights on the drug still follow ”
Assuming is true, then .
⚠️ One-tail test because the drug is expected to reduce weight (unidirectional). Rejection region:
Calculate:
⚠️ Standardized is approximately normal!
(The standardization of removes the effect of . As if it’s the summation.)
So, standardize and apply CLT:
Solve:
Therefore, the rejection region:
Link to original
Binary hypothesis testing
Theory - Binary testing, MAP and ML
Theory 1 - Binary testing, MAP and ML
Binary hypothesis test
Ingredients of a binary hypothesis test:
- and — Complementary hypotheses
- Maybe also know the prior probabilities and
- Goal: determine which case we are in, or
- and — Complementary events of the Decision Rule
- Directionality: given , is likely; given , is likely
- Decision Rule: outcome , accept ; outcome , accept
- Usually: written in terms of decision statistic using a design
- We cover three designs:
- MAP and ML (minimize ‘error probability’)
- MC (minimizes ‘error cost’)
- Designs use and (or , ) to construct and
MAP design
Suppose we know:
- and
- Both prior probabilities
- and (or and )
- Both conditional distributions
The maximum a posteriori probability (MAP) design for a decision statistic :
Discrete case:
Continuous case:
And .
The MAP design minimizes the total probability of error.
ML design
Suppose we don’t know the priors, we know only:
- and (or and )
- Both conditional distributions
The maximum likelihood (ML) design for :
ML is a simplified version of MAP. (Set and to .)
The false alarm error rate is called . The miss error rate is called .
Total probability of error:
Link to originalWrong meanings of
Suppose sets off a smoke alarm, and is ‘no fire’ and is ‘yes fire’.
Then is the odds that we get an alarm assuming there is no fire.
This is not the odds of experiencing a false alarm (no context). That would be .
This is not the odds of a given alarm being a false one. That would be .
Illustration
Example - ML test: Smoke detector
ML test: Smoke detector
Suppose that a smoke detector sensor is configured to produce when there is smoke, and otherwise. But there is background noise with distribution .
Design an ML test for the detector electronics to decide whether to activate the alarm.
What are the three error probabilities? (Type I, Type II, Total.)
Solution
First, establish the conditional distributions:
Density functions:
The ML condition becomes:
Therefore, is , while is .
The decision rule is: activate alarm when .
Type I error:
Type II error:
Total error:
Link to original
Example - MAP test: Smoke detector
MAP test: Smoke detector
Suppose that a smoke detector sensor is configured to produce when there is smoke, and otherwise. But there is background noise with distribution .
Suppose that the background chance of smoke is . Design a MAP test for the alarm.
What are the three error probabilities? (Type I, Type II, Total.)
Solution
First, establish priors:
The MAP condition becomes:
Therefore, is , while is .
The decision rule is: activate alarm when .
Type I error:
Type II error:
Total error:
Link to original
Theory - MAP criterion proof
Theory 2 - MAP criterion proof
Link to originalExplanation of MAP criterion - discrete case
First, we show that the MAP design selects for all those which render more likely than . This will be used in the next step to show that MAP minimizes probability of error.
Observe this calculation:
Recall the MAP criterion:
Divide both sides by and apply the above Calculation in reverse:
This is what we sought to prove.
Next, we verify that the MAP design minimizes the total probability of error.
The total probability of error is:
Expand this with summation notation (assuming the discrete case):
Now, how do we choose the set (and thus ) in such a way that this sum is minimized?
Since all terms are positive, and any may be placed in or in freely and independently of all other choices, the total sum is minimized when we minimize the impact of placing each .
So, for each , we place it in if:
That is equivalent to the MAP criterion.
Theory - MC design
Theory 3 - MC design
- Write for cost of false alarm, i.e. cost when is true but decided .
- Probability of incurring cost is .
- Write for cost of miss, i.e. cost when is true but decided .
- Probability of incurring cost is .
Expected value of cost incurred
MC design
Suppose we know:
- Both prior probabilities and
- Both conditional distributions and (or and )
The minimum cost (MC) design for a decision statistic :
Discrete case:
Continuous case:
Then .
The MC design minimizes the expected value of the cost of error.
Link to originalMC minimizes expected cost
Inside the argument that MAP minimizes total probability of error, we have this summation:
The expected value of the cost has a similar summation:
Following the same reasoning, we see that the cost is minimized if each is placed into precisely when the MC design condition is satisfied, and otherwise it is placed into .
Illustration
Example - MC Test: Smoke detector
MC Test: Smoke detector
Suppose that a smoke detector sensor is configured to produce when there is smoke, and otherwise. But there is background noise with distribution .
Suppose that the background chance of smoke is . Suppose the cost of a miss is the cost of a false alarm. Design an MC test for the alarm.
Compute the expected cost.
Solution
We have priors:
And we have costs:
(The ratio of these numbers is all that matters in the inequalities of the condition.)
The MC condition becomes:
Therefore, is , while is .
The decision rule is: activate alarm when .
Type I error:
Type II error:
Total error:
PMF of total cost:
Therefore .
Link to original
Mean square error
Theory - Minimum mean square error
Theory 1 - Minimum mean square error
Suppose our problem is to estimate or guess or predict the value of a random variable in a particular run of our experiment. Assume we have the distribution of . Which value do we choose as our guess?
There is no single best answer to this question. The “best guess” number depends on additional factors in the problem context.
One method is to pick a value where the PMF or PDF of is maximal. This is a value of highest probability. There may be more than one!
Another method is to pick the expected value . This value may be impossible!
For the normal distribution, or any symmetrical distribution, these are the same value. For most distributions, though, they are not the same.
Mean square error (MSE)
Given some estimate for a random variable , the mean square error (MSE) of is:
The MSE quantifies the typical (square of the) error. Error here means the difference between the true value and the estimate .
Other error estimates are reasonable and useful in niche contexts. For example, or . They are not frequently used, so we do not consider their theory further.
In problem contexts where large errors are more costly than small errors (i.e. many real problems), the most likely value of (the point with maximal PDF) may fare poorly as an estimate.
It turns out that the expected value also happens to be the value that minimizes the MSE.
Expected value minimizes MSE
Given a random variable , its expected value is the estimate of with minimal mean square error.
The MSE error for is:
Proof that minimizes MSE
Expand the MSE error:
Now minimize this parabola. Differentiate:
Find zeros:
When the estimate is made in the absence of information (besides the distribution of ), it is called a blind estimate. Therefore, is the blind minimal MSE estimate, and is the error of this estimate.
In the presence of additional information, for example that event is known, then the MSE estimate is and the error of this estimate is .
The MSE estimate can also be conditioned on another variable, say :
Minimal MSE of given
The minimal MSE estimate of given another variable :
The error of this estimate is , which equals .
Notice that the minimal MSE of given can be used to define a random variable:
This is a derived variable from given by composing with the function .
The variable provides the minimal MSE estimates of when experimental outcomes are viewed as providing the information of only, and the model is used to derive estimates of from this information.
Link to original
Illustration
Example - Minimal MSE estimate given PMF, given fixed event
Minimal MSE estimate given PMF
Suppose has the following PMF:
1 2 3 4 5 0.15 0.28 0.26 0.19 0.13 Find the minimal MSE estimate of , given that is even. What is the error of this estimate?
Solution
The minimal MSE given is just where .
First compute the conditional PMF:
Therefore:
The error is:
Link to original
Exercise - Minimal MSE estimate from joint PDF
Minimal MSE estimate from joint PDF
Here is the joint PDF of and :
Find the minimal MSE estimate of in terms of .
What is the estimate of when ? When ?
Answer
Link to original
Theory - Line of minimal MSE
Theory 2 - Line of minimal MSE
Linear approximation is very common in applied math.
One could consider the linearization of (its tangent line at some point) instead of the exact function .
One could instead minimize the MSE over all linear functions of . (Each of which is an RV.) The line with minimal MSE is called the linear estimator.
The difference here is:
- line of best fit at a single point vs.
- line of best fit over the whole range of and —weighted by likelihoods
Linear estimator: Line of minimal MSE
Let be an arbitrary line . Let us define .
The mean square error (MSE) of this line is:
The linear estimator of in terms of is the line with minimal MSE, and it is:
The error value at the (best) linear estimator, , is:
Theorem: The error variable of the linear estimator, , is perfectly uncorrelated with .
Slope and
Notice:
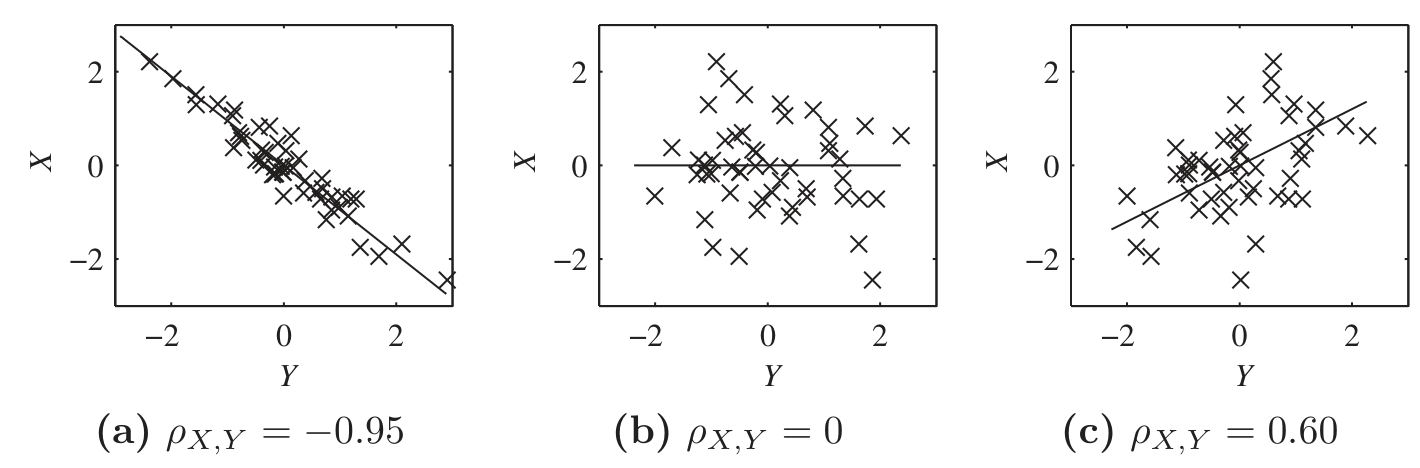
Thus, for standardized variables and , it turns out is the slope of the linear estimator.
In each graph, and .
The line of minimal MSE is the “best fit” line, .
Link to original
Illustration
Example - Estimating on a variable interval
Estimating on a variable interval
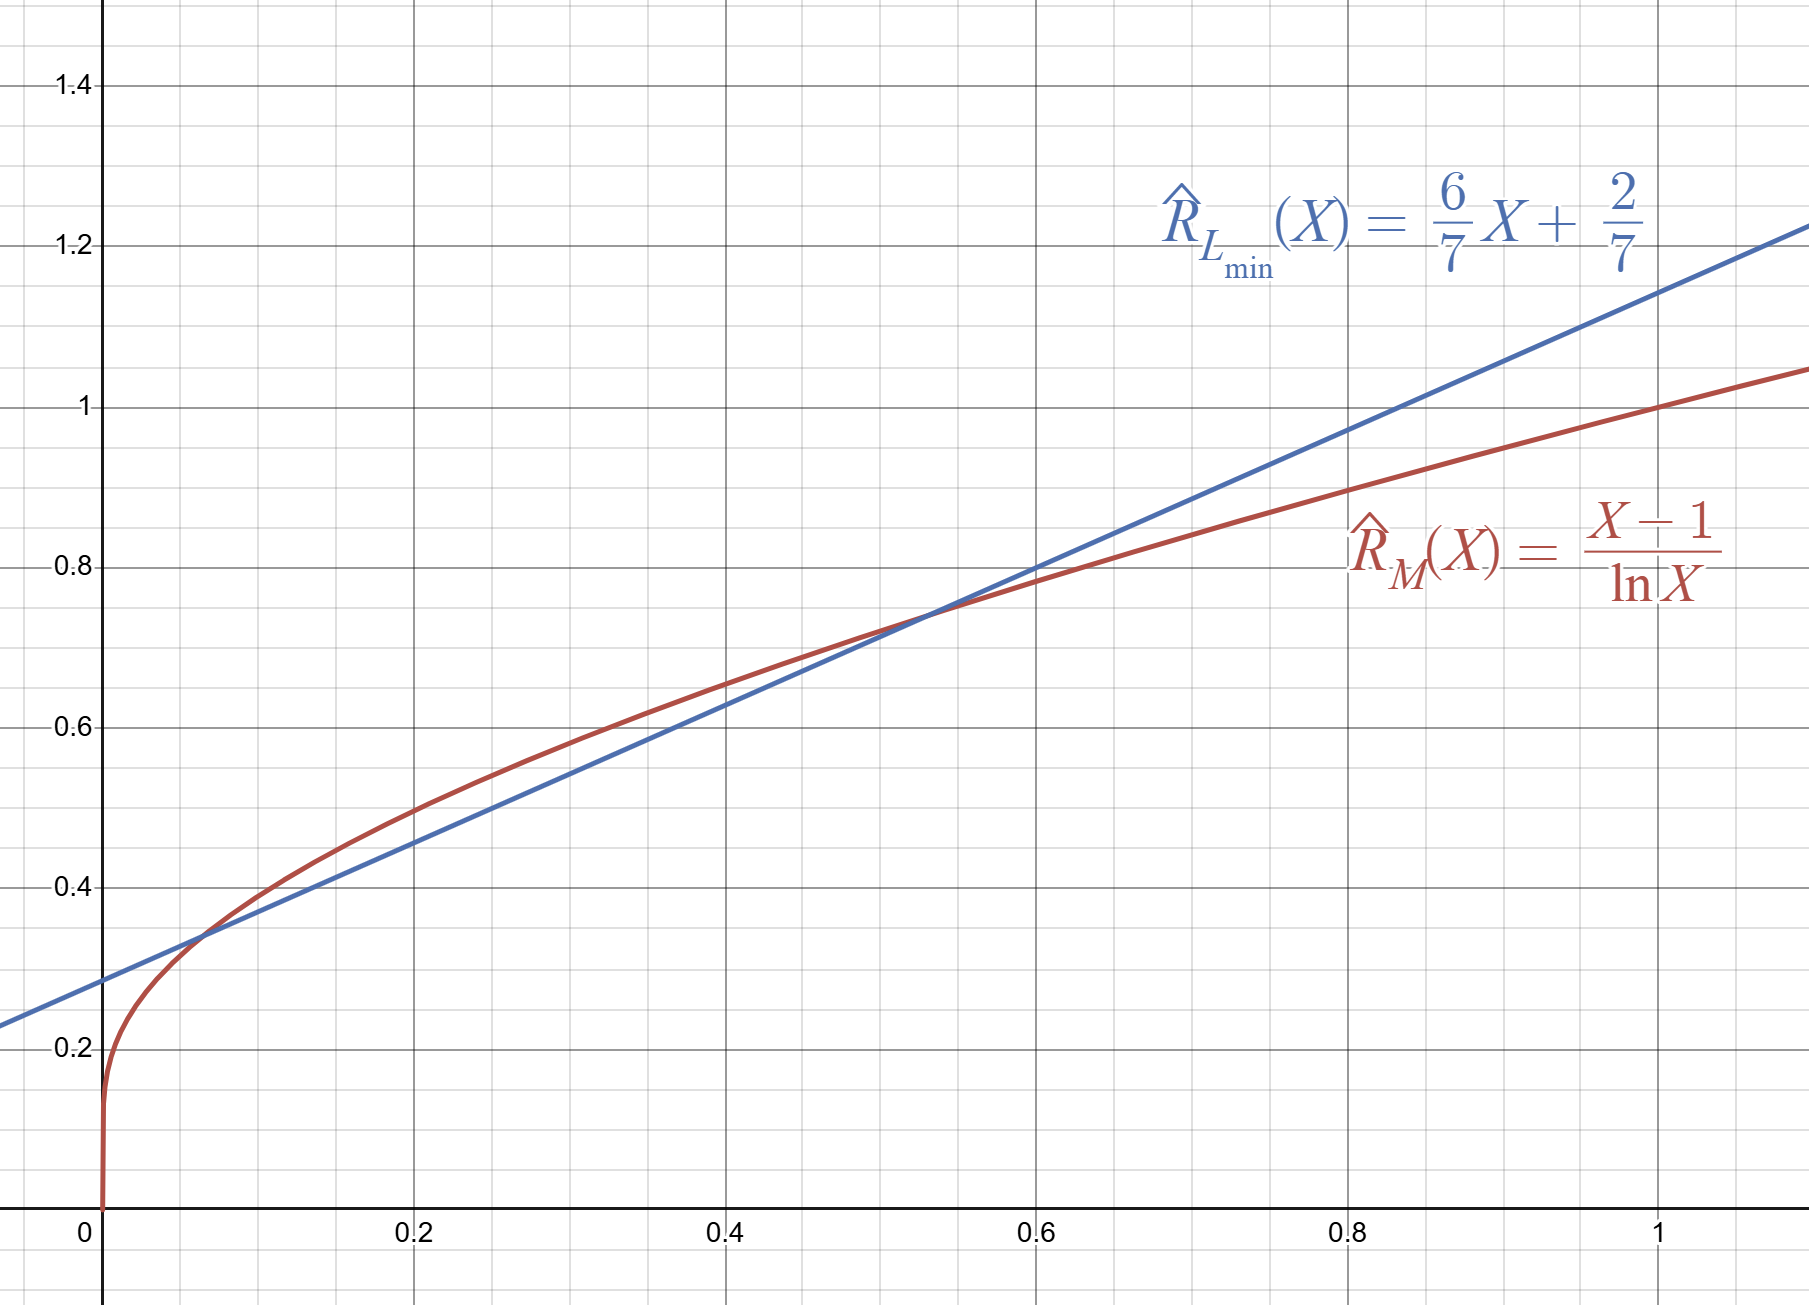
Suppose that and suppose .
(a) Find (b) Find (c) Find
Solution
(a) Find :
We know .
Given , so is uniform on , we have .
(b) Find :
We know .
We know and . From these we derive the joint distribution :
Now extract the marginal :
Now deduce the conditional :
Then:
(c) Find :
We need all the basic statistics.
because .
.
using the marginal PDF on . (IBP and L’Hopital are needed.)
also using the marginal .
using , namely:
From all this we infer and .
Hence:
Thus:
Link to original
Exercise - Line of minimal MSE given joint PDF
Line of minimal MSE given joint PDF
Here is the joint PDF of and :
Find the line giving the linear MSE estimate of in terms of .
What is the expected error of this line, ?
What is the estimate of when ? When ?
Answer
Link to original