01
Spans of column vectors
Matrices are matrices, and . Matrix has ones everywhere on and above the main diagonal, down to the row, and zeros elsewhere, including everything after the row. Matrix has ones on the main diagonal only, down to the row, and zeros everywhere else. Show that the span of the column vectors of is the same subspace as the span of the column vectors of . What subspace is it?
(Hint: first try to verify the assertion for small values of and , for example when and , and then and or . Then see if you can generalize your method to all .)
02
Computing dimensions by hand
- Show that the span has dimension as a subspace by using the “exchange” technique.
- Show that the span has dimension as a subspace by using the “exchange” technique.
- Show that the span has dimension as a subspace.
03
Suppose we are given a collection of data points .
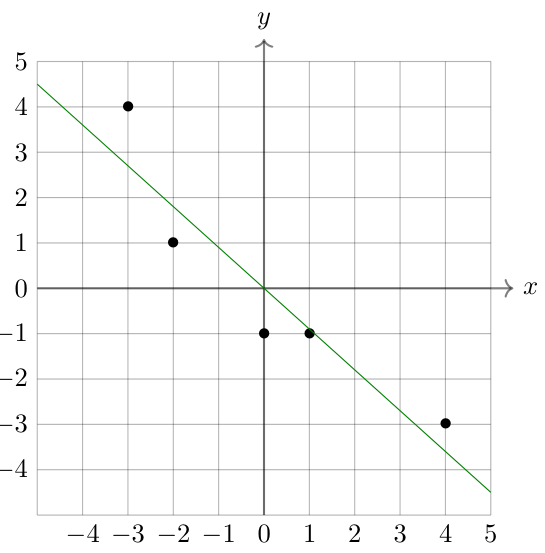
Later in the course, we will learn how to compute the linear regression of this data, namely the line of best fit. In this problem, you will learn about the correlation coefficient of the data: a measure of how linear the data is. There is no point in computing a linear regression if the data is not very linear!
First, let and . Then let be the average of the , and be the average of the . Therefore and have zero average. (By subtracting a scalar from a vector, we really mean to subtract the scalar from each component.) Then define the correlation coefficient:
Correlation coefficient
Problem: Compute the correlation coefficient of the data:
The correlation coefficient is frequently written ‘’. The formula describes as a dot product of unit vectors, so . When , the data are very linear. When , the data lie on a line with positive slope, meaning that if you increase then you expect to increase as well. When , the data lie on a line with negative slope, so if you increase then you expect to decrease.
Later, in linear regression as projection, we will see why measures linearity. For now, consider the following. Suppose the data is linear, so for some and . Then as vectors, we have . If we subtract the average of both sides, we have
Therefore is a scalar multiple of , and the dot product of their unit vectors tells us whether they align or anti-align.
This problem (and its sequel) illustrates the use of D vectors to study data that is presented as D vectors.