Introduction
Uniform Manifold Approximation and Prediction
The goal of UMAP is to rebuild the data in a high space as:
- Low-dimensional manifold
- The data is first cast as a weighted graph (1-dimensional)
- Uniform sampling assumption
- Dense clusters are spread apart and sparse areas contracted
UMAP process
We are given a data cloud , and a neighbor-count .
(1) Create weighted partial graphs local to each data point:
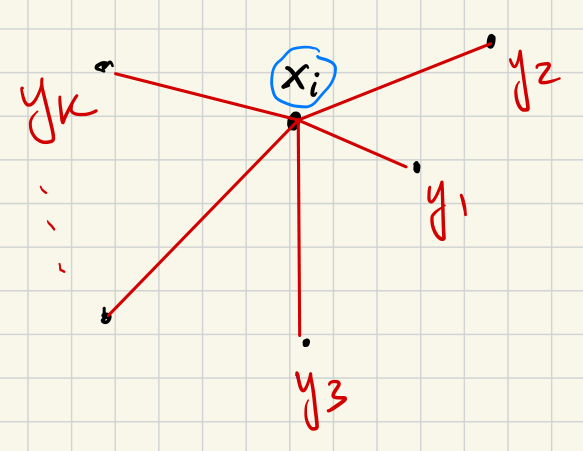
For each point , define weights as follows:
- Set .
- All are infinitely far from each other: for .
- For :
- Require that is proportional to ,
- Require that .
That is, the nearest neighbor is placed at distance from , and the other neighbors are made closer to by the distance removed. For each fixed , the collection encodes metric structure of the original data near but with the closest point substituted for .
The weight is supposed to be interpreted as the probability that the point will lie in the same cluster as the point .
From these requirements it is possible to deduce a formula for , as follows:
Set . (Distance to the closest neighbor.) For each , solve for such that:
The idea is that for the closest neighbor , the weight should be the highest; the weight should decrease for neighbors that are farther away.
(2) Glue partial metrics into a single weighted graph:
Now we define a single weighted graph with vertices the points and weights coming from the set of partial graphs defined in Step (1).
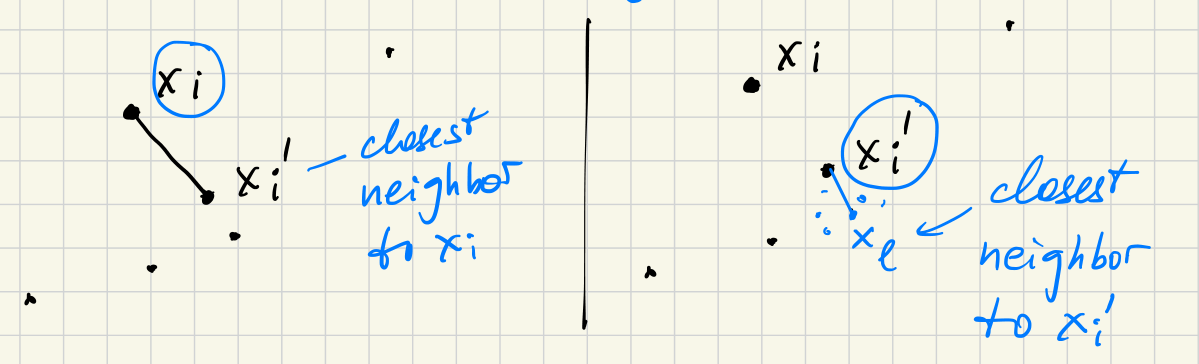
Observe that a given pair of vertices could appear with finite distance in at most two partial graphs. The relation of being “nearest neighbor” is not in general symmetric:
Now, let us be given a pair of vertices .
If this pair appears (with finite weight) in only one partial graph, give the pair a weighted edge in the total graph with the same weight it had in that partial graph.
If this pair appears in two partial graphs, then is the center point in one of them and is the center in the other.
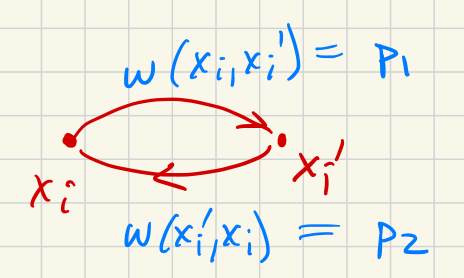
We combine the weights as follows:
- Let
- Let
Then the weight on the pair shall be defined as:
Now we have defined a total weighted graph that combines the information from all the weighted partial (local) graphs.
(3) Embed the total weighted graph in a lower-dimensional space as a weighted graph .
This can be done with standard techniques that we don’t cover here. Briefly:
Start with the spectral graph embedding. Edge weights for edge are in and in . Cross-entropy formula:
Use this cross-entropy as a cost function and perform stochastic gradient descent to minimize the cost.
Gradient descent
Suppose we are given a cost function .
Given any , the gradient of , written , is the direction of the largest rate of change of .
Smallest rate of change is .
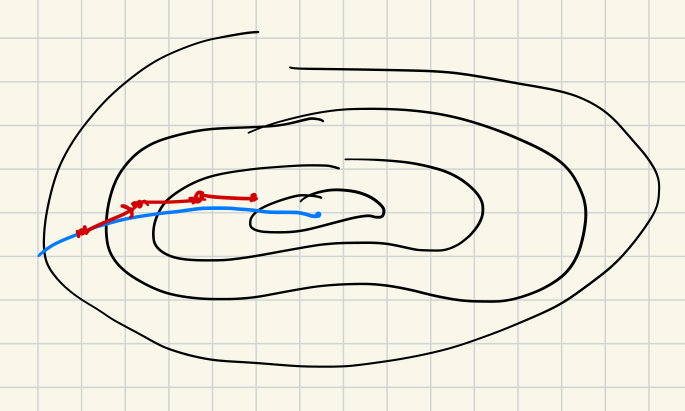
Illustration - uniform sampling assumption
UMAP is based on an assumption that the data samples uniformly from a manifold.
Illustration - UMAP figure from Böhm et al 2022
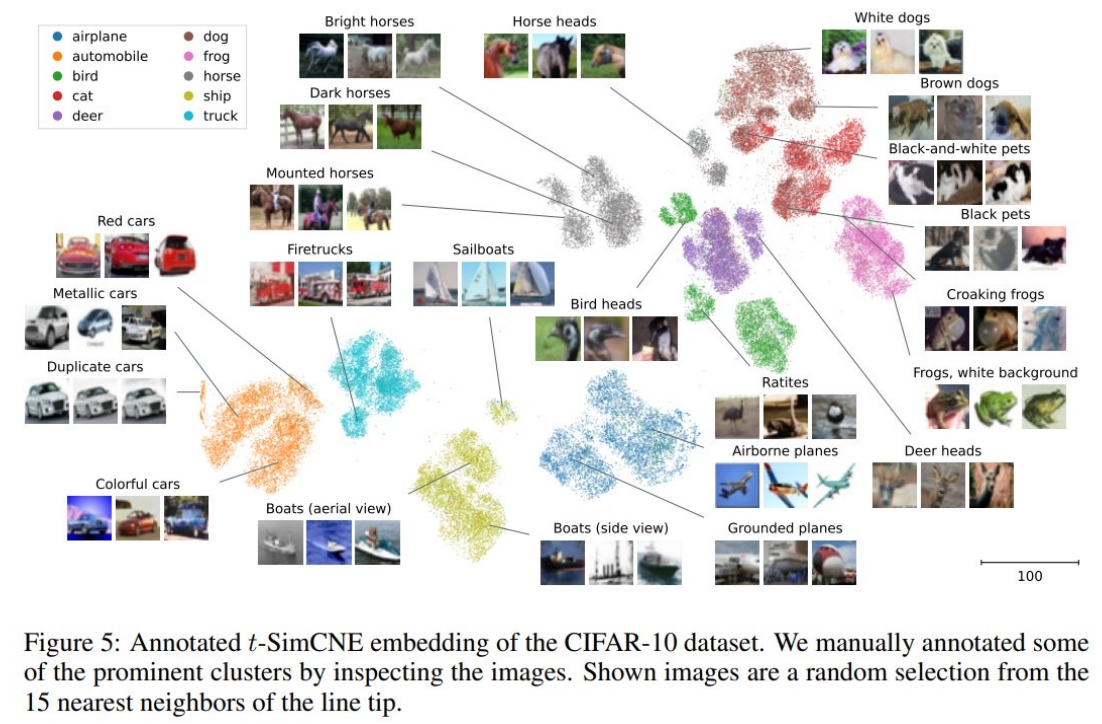
(Böhm et al. 2022)