Poisson process
01 Theory - Poisson variable
Theory 1 - Poisson variable
Poisson variable
A random variable is Poisson, written , when counts the number of “arrivals” in a fixed “window.” It is applicable when:
- The arrivals come at a constant average rate.
- The arrivals are independent of each other.
Poisson PMF:
The “window rate” must be computed from the “background rate” using the window size.
A Poisson variable is comparable with a binomial variable. Both count the occurrences of some “arrivals” over some “space of opportunity.”
- The binomial opportunity is a set of repetitions of a trial.
- The Poisson opportunity is a continuous interval of time.
In the binomial case, success occurs at some rate , since where is the success event.
In the Poisson case, arrivals occur at some rate .
The Poisson distribution is actually the limit of binomial distributions by taking while remains fixed, so in perfect balance with .
Fix and define . (So is computed to ensure the average rate does not change.) Let and let . Then for any :
For example, let , so with , and look at as :
Link to originalInterpretation - Binomial model of rare events
Let us interpret the assumptions of this limit. For large but small such that remains moderate, the binomial distribution describes a large number of trials, a low probability of success per trial, but a moderate total count of successes.
This setup describes a physical system with a large number of parts that may activate, but each part is unlikely to activate; and yet the number of parts is so large that the total number of arrivals is still moderate.
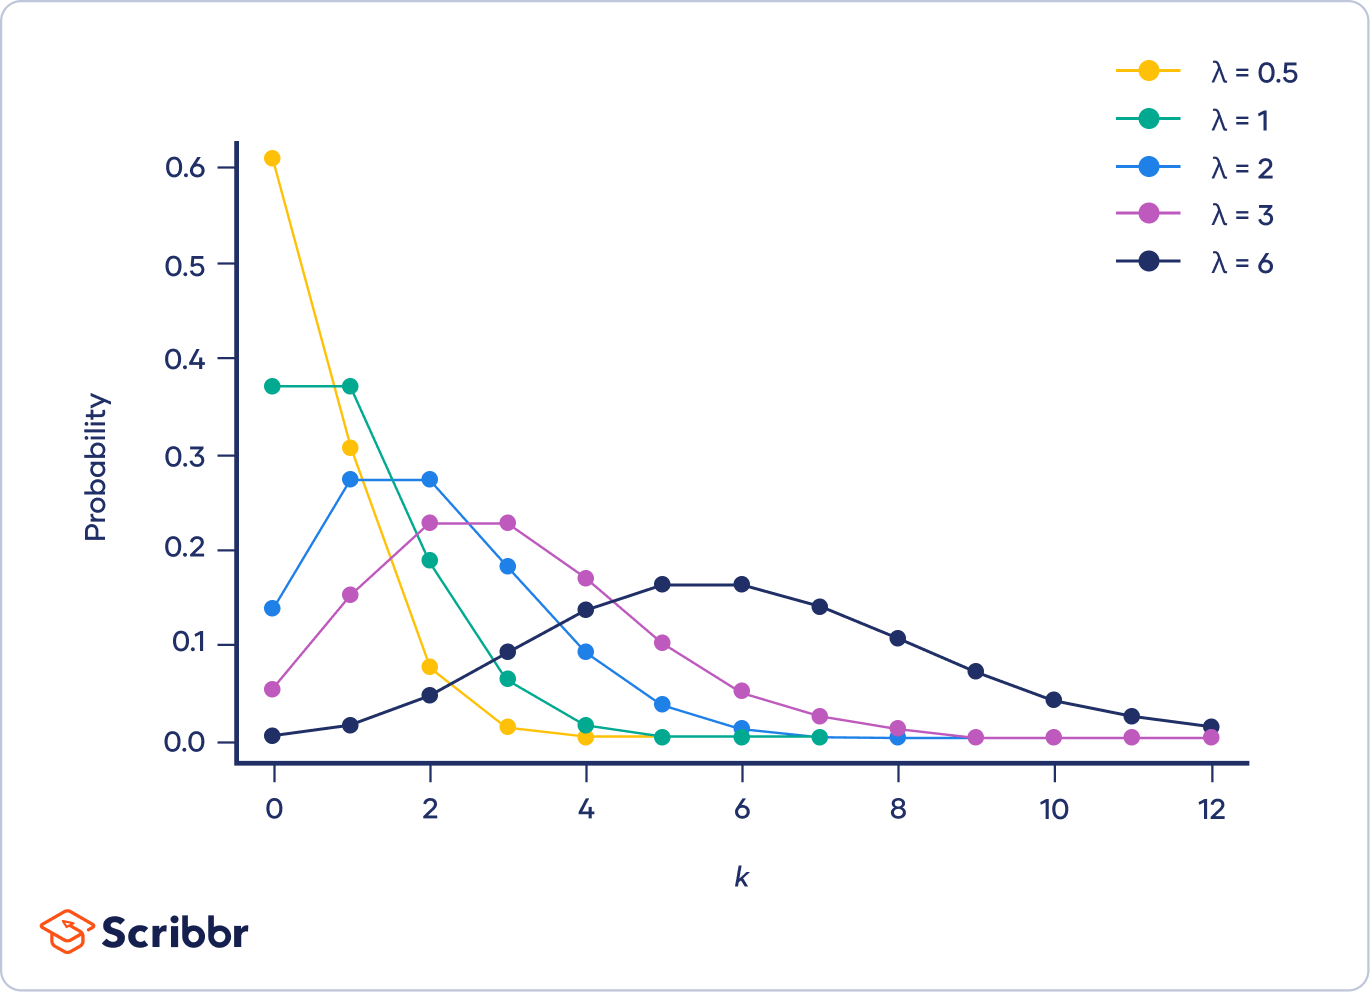
02 Illustration
Example - Arrivals at a post office
Arrivals at a post office
Client arrivals at a post office are modelled well using a Poisson variable.
Each potential client has a very low and independent chance of coming to the post office, but there are many thousands of potential clients, so the arrivals at the office actually come in moderate number.
Suppose the average rate is 5 clients per hour.
(a) Find the probability that nobody comes in the first 10 minutes of opening. (The cashier is considering being late by 10 minutes to run an errand on the way to work.)
(b) Find the probability that 5 clients come in the first hour. (I.e. the average is achieved.)
(c) Find the probability that 9 clients come in the first two hours.
Solution
(a)
Expect clients every 10 minutes. Therefore, let . Seek as the answer.
PMF:
Insert data and compute:
(b)
Rate is already correct. Let .
PMF:
(c)
Expect 10 clients every 2 hours. Therefore let .
PMF:
Notice that 0.125 is smaller than 0.175.
Link to original
Example - Random leukemia?
Random leukemia?
Suppose the rate of leukemia in a random population is expected to be 8.3 cases per million.
Suppose a given town of 150,000 residents has 12 cases. Is that suspicious?
(Compute the probability of 12 or more cases assuming a Poisson distribution.)
Solution
The expected case rate for 150,000 residents is:
Therefore, with a “window” of 150,000, the case rate should be . Set .
Now compute:
Therefore the observed case rate is highly suspicious!
Link to original
Example - Radioactive decay is Poisson
Radioactive decay is Poisson
Consider a macroscopic sample of Uranium.
Each atom decays independently of the others, and the likelihood of a single atom popping off is very low; but the product of this likelihood by the total number of atoms is a moderate number.
So there is some constant average rate of atoms in the sample popping off, and the number of pops per minute follows a Poisson distribution.
Link to original
Example - Typos per page
Typos per page
A draft of a textbook has an average of 6 typos per page.
What is the probability that a randomly chosen page has typos?
(Answer: 0.849. Hint: study the complementary event.)
Link to original
03 Theory - Poisson limit of binomial
Theory 2 - Poisson limit of binomial
Link to originalExtra - Derivation of binomial limit to Poisson
Consider a random variable , and suppose is very large.
Suppose also that is very small, such that is not very large, but the extremes of and counteract each other. (Notice that then will not be large so the normal approximation does not apply.) In this case, the binomial PMF can be approximated using a factor of . Consider the following rearrangement of the binomial PMF:
Since is very large, the factor in brackets is approximately , and since is very small, the last factor of is also approximately 1 (provided we consider small compared to ). So we have:
Write , a moderate number, to find:
Here at last we find , since as . So as :
04 Theory - Poisson expected value
02
Expectation of Poisson
Derive the formula for a Poisson variable .
Link to originalSolution
05 Theory
Theory 1
Exponential variable
A random variable is exponential, written , when measures the wait time until first arrival in a Poisson process with rate .
Exponential PDF:
- Poisson is continuous analog of binomial
- Exponential is continuous analog of geometric
Notice the coefficient in . This ensures :
Notice the “tail probability” is a simple exponential decay:
(Compute an improper integral to verify this.)
Erlang variable
A random variable is Erlang, written , when measures the wait time until arrival in a Poisson process with rate .
Erlang PDF:
Link to original
- Erlang is continuous analog of Pascal
06 Illustration
Example - Earthquake wait time
Earthquake wait time
Suppose the San Andreas fault produces major earthquakes modeled by a Poisson process, with an average of 1 major earthquake every 100 years.
(a) What is the probability that there will not be a major earthquake in the next 20 years?
(b) What is the probability that three earthquakes will strike within the next 20 years?
Solution
(a)
Since the average wait time is 100 years, we set earthquakes per year. Set and compute:
(b)
The same Poisson process has the same earthquakes per year. Set , so:
Now compute:
Link to original
07 Theory
Theory 2
Link to originalThe memoryless distribution is exponential
The exponential distribution is memoryless.
This means that knowledge that an event has not yet occurred does not affect the probability of its occurring in future time intervals:This is easily checked using the PDF:
No other continuous distribution is memoryless.
This means any other (continuous) memoryless distribution agrees in probability with the exponential distribution. The reason is that the memoryless property can be rewritten as . Consider as a function of , and notice that this function converts sums into products. Only the exponential function can do this.The geometric distribution is the discrete memoryless distribution.
and by substituting , we also know .
Then:
Derived random variables
08 Theory
Theory 1
By composing any function with a random variable we obtain a new random variable . This one is called a derived random variable.
Notation
The derived random variable may be written “”.
Expectation of derived variables
Discrete case:
(Here the sum is over all possible values of , i.e. where .)
Continuous case:
Notice: when applied to outcome :
- is the output of
- is the output of
The proofs of these formulas are tricky because we must relate the PDF or PMF of to that of .
Proof - Discrete case - Expectation of derived variable
Linearity of expectation
For constants and :
For any and on the same probability model:
Exercise - Linearity of expectation
Using the definition of expectation, verify both linearity formulas for the discrete case.
Be careful!
Usually .
For example, usually .
We distribute over sums but not products (unless the factors are independent).
Variance squares the scale factor
For constants and :
Thus variance ignores the offset and squares the scale factor. It is not linear!
Proof - Variance squares the scale factor
Extra - Moments
The moment of is defined as the expectation of :
Discrete case:
Continuous case:
A central moment of is a moment of the variable :
The data of all the moments collectively determines the probability distribution. This fact can be very useful! In this way moments give an analogue of a series representation, and are sometimes more useful than the PDF or CDF for encoding the distribution.
Link to original
09 Illustration
Example - Function given by chart
Expectation of function on RV given by chart
Suppose that in such a way that and and and no other values are mapped to . Define .
1 2 3 4 1 87 Then:
And:
Therefore:
Link to original
Example - PMF across many-to-one function
PMF through many-to-one function
Suppose the PMF of is given by:
Now suppose . That is to say, and .
What is the PMF of ?
Solution
Notice that and . So and are combined into :
Link to original
Example - Average pay raise
Average pay raise
Suppose the average salary at Company A is $52,000. Each employee is given a 3% raise and a $2000 bonus. What is the average salary now?
Solution
Let be a random variable indicating the starting salary of each employee.
Then is a random variable giving the new salary of each employee.
We can calculate the expectation by linearity:
Link to original
Example - Variance of uniform random variable
Variance of uniform random variable
The uniform random variable on has distribution given by when .
(a) Find using the shorter formula.
(b) Find using “squaring the scale factor.”
(c) Find directly.
Solution
(a)(1) Compute density.
The density for is:
(2) Compute and directly using integral formulas.
Compute :
Now compute :
(3) Find variance using short formula.
Plug in:
(b)
(1) “Squaring the scale factor” formula:
(2) Plugging in:
(c)
(1) Density.
The variable will have the density spread over the interval .
Density is then:
(2) Plug into prior variance formula.
Use and .
Get variance:
Simplify:
Link to original
10 Theory
Theory 2
Suppose we are given the PDF of , a continuous RV.
What is the PDF , the derived variable given by composing with ?
PDF of derived
The PDF of is not (usually) equal to .
Relating PDF and CDF
When the CDF of is differentiable, we have:
Therefore, if we know , we can find using a 3-step process:
(1) Integrate PDF to get CDF:
(2) Find , the CDF of , by comparing conditions:
When is monotone increasing, we have equivalent conditions:
(3) Differentiate CDF to recover PDF:
Link to originalAlternative: Method of differentials
Change variables:
The measure for integration is .
Set so and .
Thus .
So the measure of integration in terms of is .Warning: this assumes the function is one-to-one.
11 Illustration
Example - PDF of derived from CDF
PDF of derived from CDF
Suppose that .
(a) Find the PDF of . (b) Find the PDF of .
Solution
(a)
Formula:
Plug in:
(b)
By definition:
Since is increasing, we know:
Therefore:
Then using differentiation:
Link to original