Expectation for two variables
07 Theory
Theory 1
Expectation for a function on two variables
Discrete case:
Continuous case:
These formulas are not trivial to prove, and we omit the proofs. (Recall the technical nature of the proof we gave for in the discrete case.)
Expectation sum rule
Suppose and are any two random variables on the same probability model.
Then:
We already know that expectation is linear in a single variable: .
Therefore this two-variable formula implies:
Expectation product rule: independence
Suppose that and are independent.
Then we have:
Extra - Proof: Expectation sum rule, continuous case
Suppose and give marginal PDFs for and , and gives their joint PDF.
Then:
Observe that this calculation relies on the formula for , specifically with .
Link to originalExtra - Proof: Expectation product rule
08 Illustration
from joint PMF chart
Expectation of X squared plus Y from joint PMF chart
Suppose the joint PMF of and is given by this chart:
0.2 0.2 0.35 0.1 0.05 0.1 Define . Find the expectation .
Solution
First compute the values of for each pair in the chart:
0 3 1 4 2 5 Now take the sum, weighted by probabilities:
Link to original
Exercise - Understanding expectation for two variables
Understanding expectation for two variables
Suppose you know only that and .
Which of the following can you calculate?
Link to original
two ways, and , from joint density
Expectation of Y two ways and Expectation of XY from joint density
Suppose and are random variables with the following joint density:
(a) Compute using two methods.
(b) Compute .
Solution
(a)
(1) Method One: via marginal PDF :
Then expectation:
(2) Method Two: directly, via two-variable formula:
(b) Directly, via two-variable formula:
Link to original
Covariance and correlation
09 Theory
Theory 1
Write and .
Observe that the random variables and are “centered at zero,” meaning that .
Covariance
Suppose and are any two random variables on a probability model. The covariance of and measures the typical synchronous deviation of and from their respective means.
Then the defining formula for covariance of and is:
There is also a shorter formula:
To derive the shorter formula, first expand the product and then apply linearity.
Notice that covariance is always symmetric:
The self covariance equals the variance:
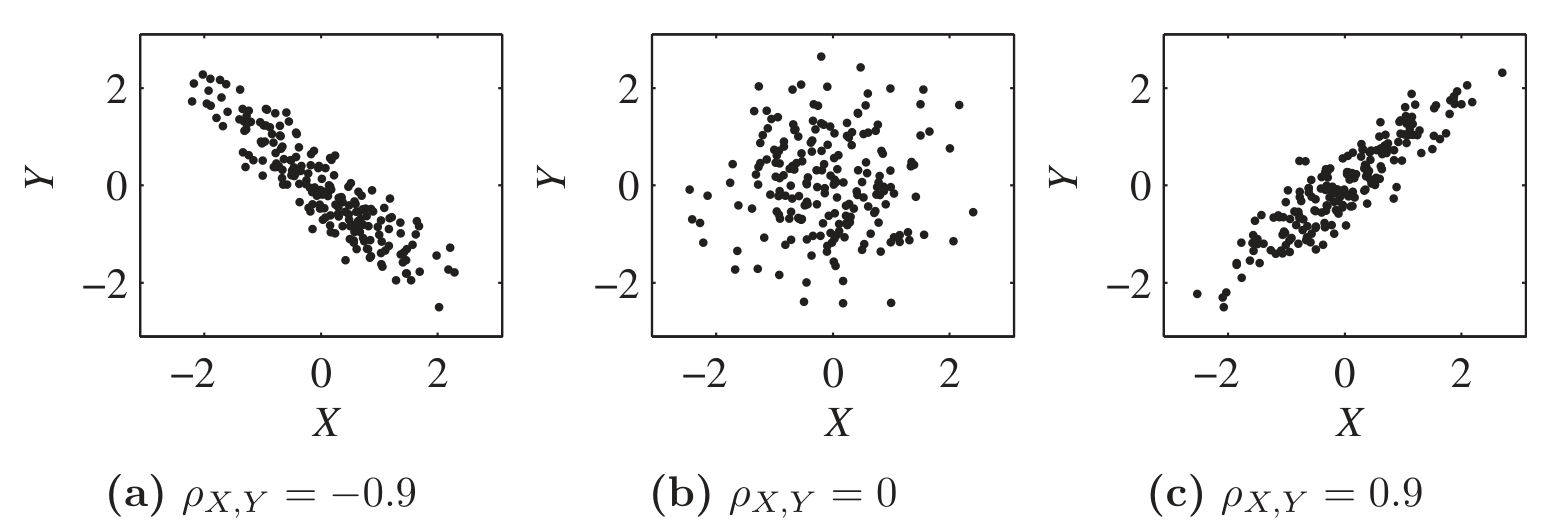
The sign of reveals the correlation type between and :
Correlation Sign Positively correlated Negatively correlated Uncorrelated Correlation coefficient
Suppose and are any two random variables on a probability model.
Their correlation coefficient is a rescaled version of covariance that measures the synchronicity of deviations:
The rescaling ensures:
Covariance depends on the separate variances of and as well as their relationship.
Correlation coefficient, because we have divided out , depends only on their relationship.
Link to original
10 Illustration
Covariance from PMF chart
Covariance from PMF chart
Suppose the joint PMF of and is given by this chart:
0.2 0.2 0.35 0.1 0.05 0.1 Find .
Solution
We need and and .
Therefore:
Link to original
11 Theory
Theory 2
Covariance bilinearity
Given any three random variables , , and , we have:
Covariance and correlation: shift and scale
Covariance scales with each input, and ignores shifts:
Whereas shift or scale in correlation only affects the sign:
Extra - Proof of covariance bilinearity
Extra - Proof of covariance shift and scale rule
Independence implies zero covariance
Suppose that and are any two random variables on a probability model.
If and are independent, then:
Proof:
We know both of these:
But , so those terms cancel and .
Sum rule for variance
Suppose that and are any two random variables on a probability space.
Then:
When and are independent:
Extra - Proof: Sum rule for variance
Link to originalExtra - Proof that
(1) Create standardizations:
Now and satisfy:
Observe that for any . Variance can’t be negative.
(2) Apply the variance sum rule.
Apply to and :
Simplify:
Notice effect of standardization:
Therefore .
(3) Modify and reapply variance sum rule.
Change to :
Simplify:
12 Illustration
Variance of sum of indicators
Variance of sum of indicators
An urn contains 3 red balls and 2 yellow balls.
Suppose 2 balls are drawn without replacement, and counts the number of red balls drawn.
Find .
Solution
Let indicate (one or zero) whether the first ball is red, and indicate whether the second ball is red, so .
Then indicates whether both drawn balls are red; so it is Bernoulli with success probability . Therefore .
We also have .
The variance sum rule gives:
Link to original
Exercise - Covariance rules
Covariance rules
Simplify:
Link to original
Exercise - Independent variables are uncorrelated
Dependent but uncorrelated variables
Let be given with possible values and PMF given (uniformly) by for all three possible . Let .
Show that and are dependent but uncorrelated.
Hint: To speed the calculation, notice that .
Link to original