Dimensionality reduction and manifold learning
Introduction
These techniques work well if the given data happens to lie near a lower-dimensional vector subspace or submanifold of the original space.
Foundational algorithms are
- PCA “principle component analysis” — vector subspaces
- starts with a finite metric space (point-cloud data)
- MDS “multidimensional sampling” — manifold subspaces
- starts with arbitrary metric space
Goal:
Given (small) , find an optimal map which in some sense represents the structure of the data by minimizing the error:
Link to original
Theory - PCA
PCA
Let be an matrix with eigenvalues and eigenvectors , so .
Recall that if is symmetric, we know that and
For PCA, we start with . Fix small.
The goal is to find an “optimal” linear map which distorts distances between data points as little as possible. (Minimal mean-square error.)
PCA Algorithm:
(1) NormalizationConsider and let .
(2) Covariance matrix
Define the covariance matrix :
Note that . Then, since each summand of is symmetric, must be symmetric.
(3) Eigenvalues
Compute the top (largest) eigenvalues of .
If these are pairwise distinct, the corresponding eigenvectors are all linearly independent, so they span a -dimensional linear subspace .
Consider the orthogonal projection .
(Note: one must somehow identify with first.)
If some eigenvalue has multiplicity, then consider the corresponding eigenspace .
Theorem:
The outcome of this algorithm is an optimal which minimizes the error .
(In the context of PCA or MDS, in fact.)
Link to originalCombining techniques
It is often reasonable to combine techniques discussed thus far.
For example, the outcome of PCA/MDS may be fed into Mapper; a coordinate project in the PCA output may be used as the filter function.
Theory - MDS
MDS
Multi-dimensional scaling starts with an arbitrary finite metric space , and attempts to embed this in in a way that is optimal in the sense of minimizing . This is done as follows:
(1) Metric matrix:
(2) and
Let be the matrix where is the matrix with all entries .
Let be the matrix .
(This step centers the result at the origin.)
(3) Define :
Create a matrix with columns the eigenvectors , normalized so that . Then:
Link to original
Theory - Isomap manifold learning
Isomap manifold learning
The given data is aligned along a non-linear subspace of .
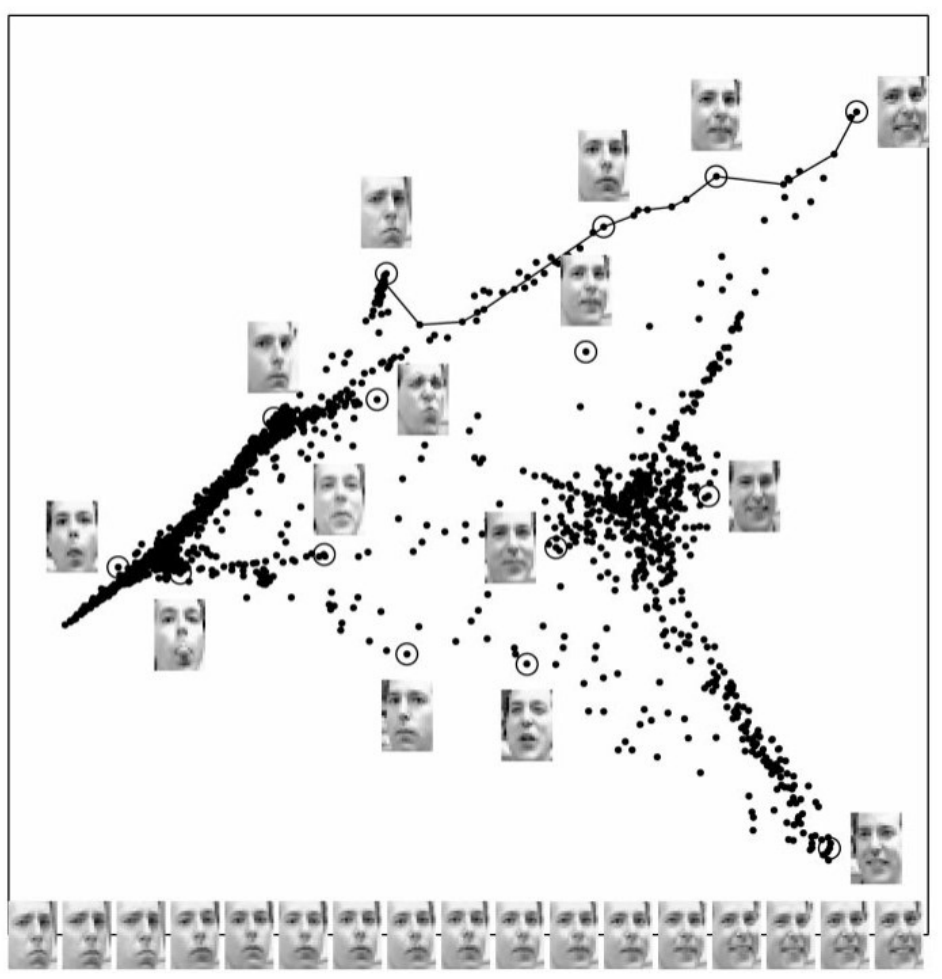
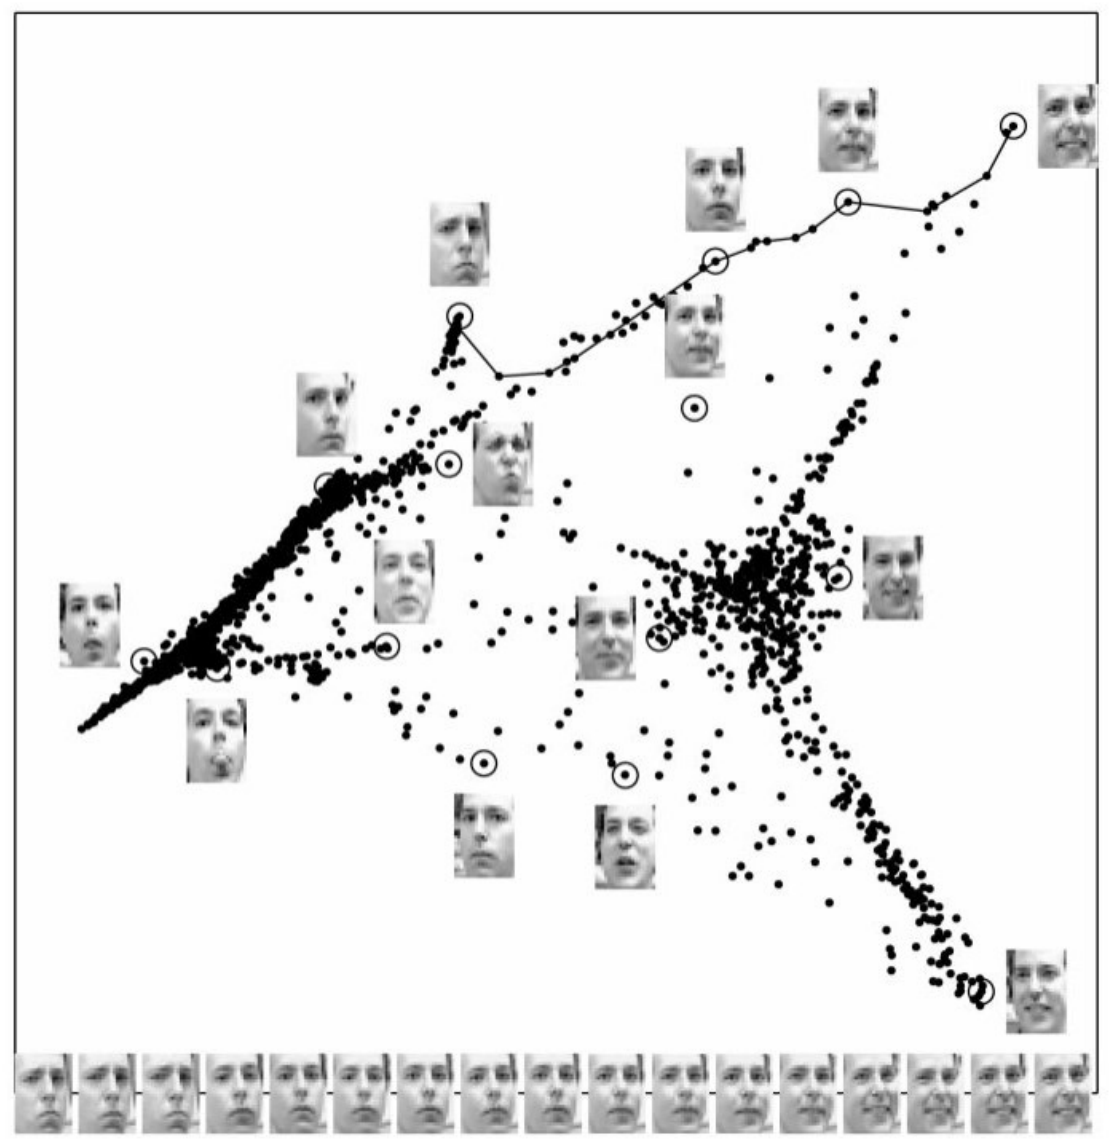
This method is used in facial recognition, for example.
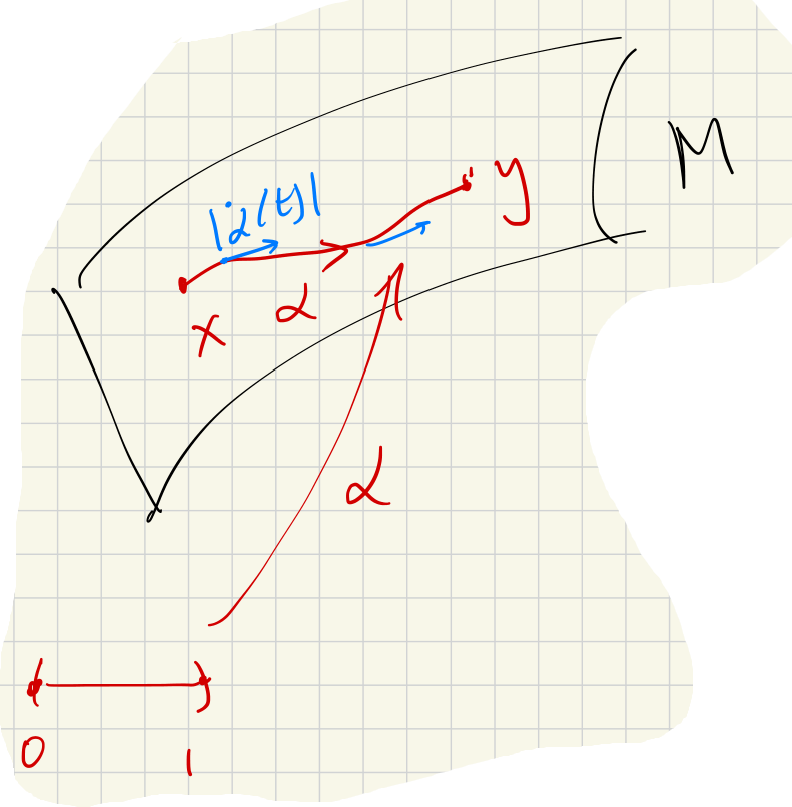
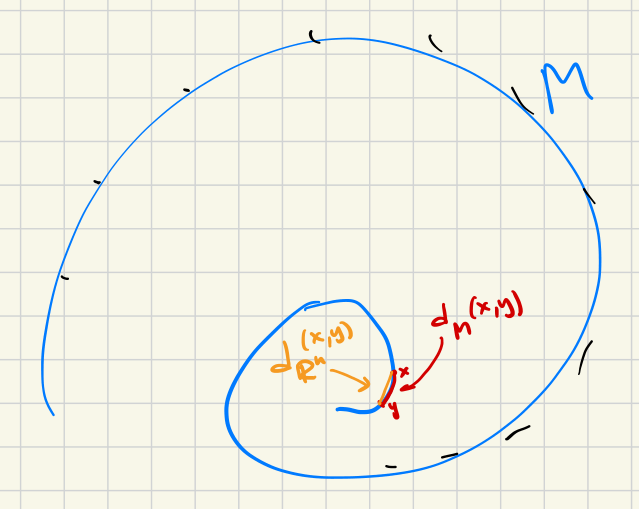
We are assuming that the data lies along (very near) a submanifold . This is assumed to have an “intrinsic” metric for .
The idea of isomap is that, assuming is smoothly embedded, there is a scale at which
Isomap description in detail:
Let us be given , as well as a scale and a target dimension .
Isomap procedure
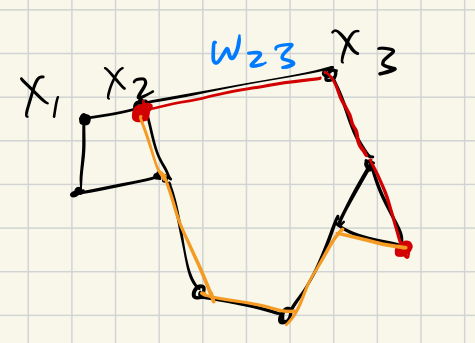
(1) Build weighted graph :
- Vertices: the points
- Edges: join to when
- Weights: the distances
(2) New metric space :
Same points, new distances:
(Use Dijkstra’s Algorithm to compute the minimal path.)
(3) Apply PCA/MDS:
Find an optimal map .
Isomap - single chart
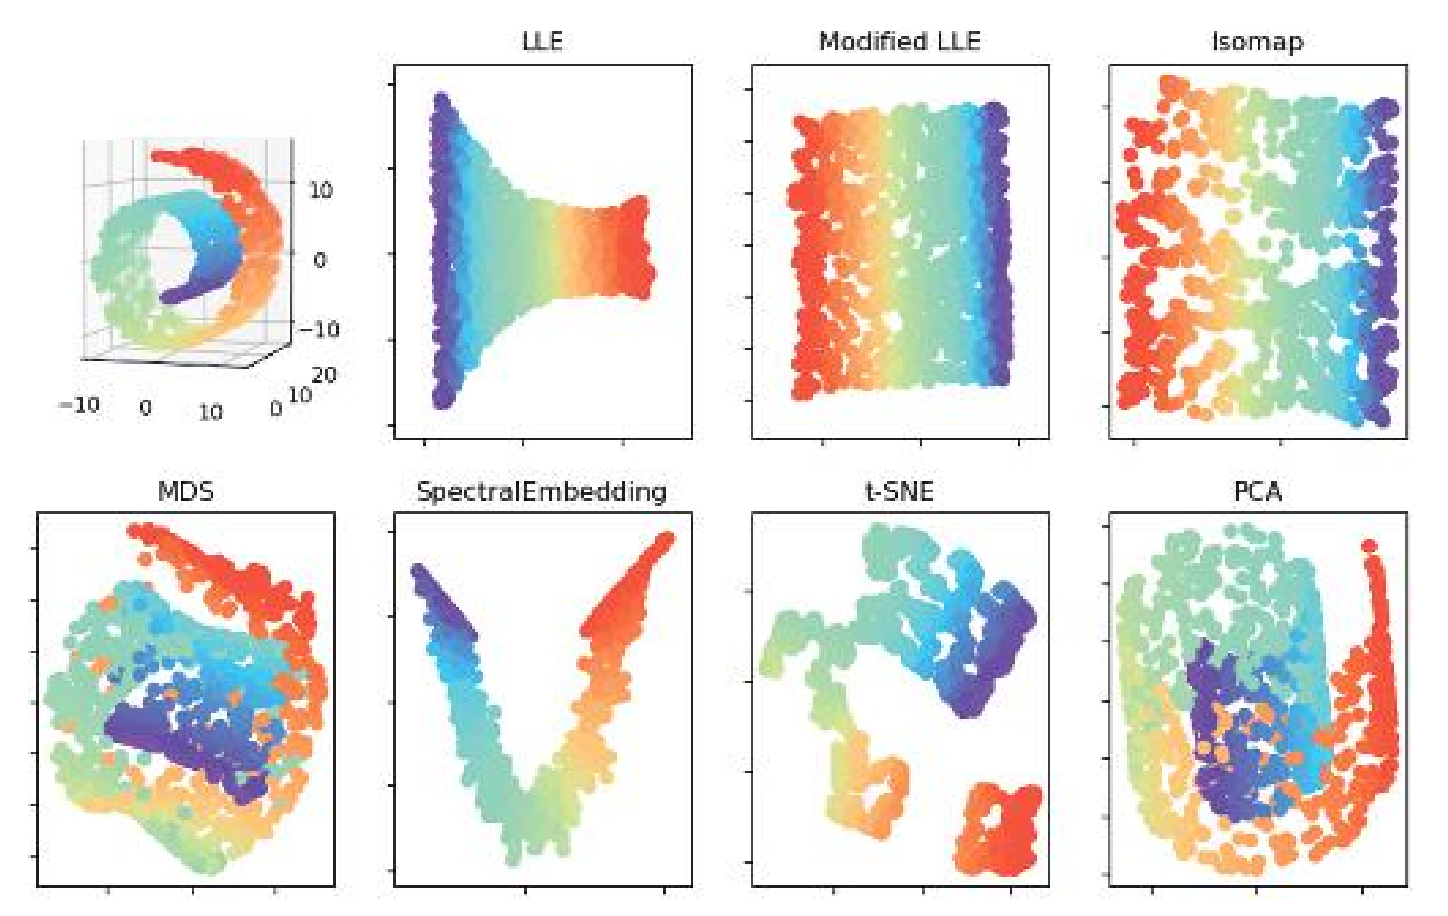
Isomap is most effective when the manifold can be covered by a single chart and the algorithm effectively “flattens” and “unrolls” the space.
It is less effective for manifolds with topology. For example, when applied to , the output of isomap is a flat disk.
(Rabadan-Blumberg 2020)
Link to original
Theory - Local Linear Embedding (LLE)
Local Linear Embedding (LLE)
LLE is a variation of isomap manifold learning that is “locally linear.” It does not attempt to preserve the metric globally. The algorithm is a little more efficient than isomap as well.
LLE Procedure
Suppose we are given the data set , the target dimension and a “neighborhood size” .
(1) Find minimizer weights:
For each , find weights that minimize the error:
subject to the constraints:
The weights determine approximations of a point using the plane that best fits its neighbors. If the manifold is actually linear around a point, the error at that point will be zero.
(2) Use minimizer weights to recover points:
Find points that minimize the error:
The new embedding is .
Link to originalLocality
The Isomap and LLE algorithms are local, meaning that the output is determined by the data around . Data points far from have no effect on .
Laplacian eigenmaps
Introduction
The Laplace operator on smooth functions on may be written in a variety of ways:
We would like to extend the concept of to
Link to original
- smooth manifolds (coordinate independent version)
- graphs (combinatorial version)
Theory - Laplace-Beltrami operator
Laplace-Beltrami operator
The extension of the concept of to smooth manifolds is called the Laplace-Beltrami operator. It is still defined as the divergence of the gradient, but these too must be upgraded to the context of manifolds.
Write for the space of smooth functions . Write for the space of differential -forms on . The exterior derivative is a map:
and the co-differential is a map:
(It is defined using the Hodge star operator.) Then .
The spectrum of is the set of eigenfunctions , meaning functions satisfying:
for some .
If you know the complete spectrum of , then you know a lot about the shape of (although you may not be able to recover completely).
Link to original
Theory - Laplacian for graphs
Laplacian for graphs
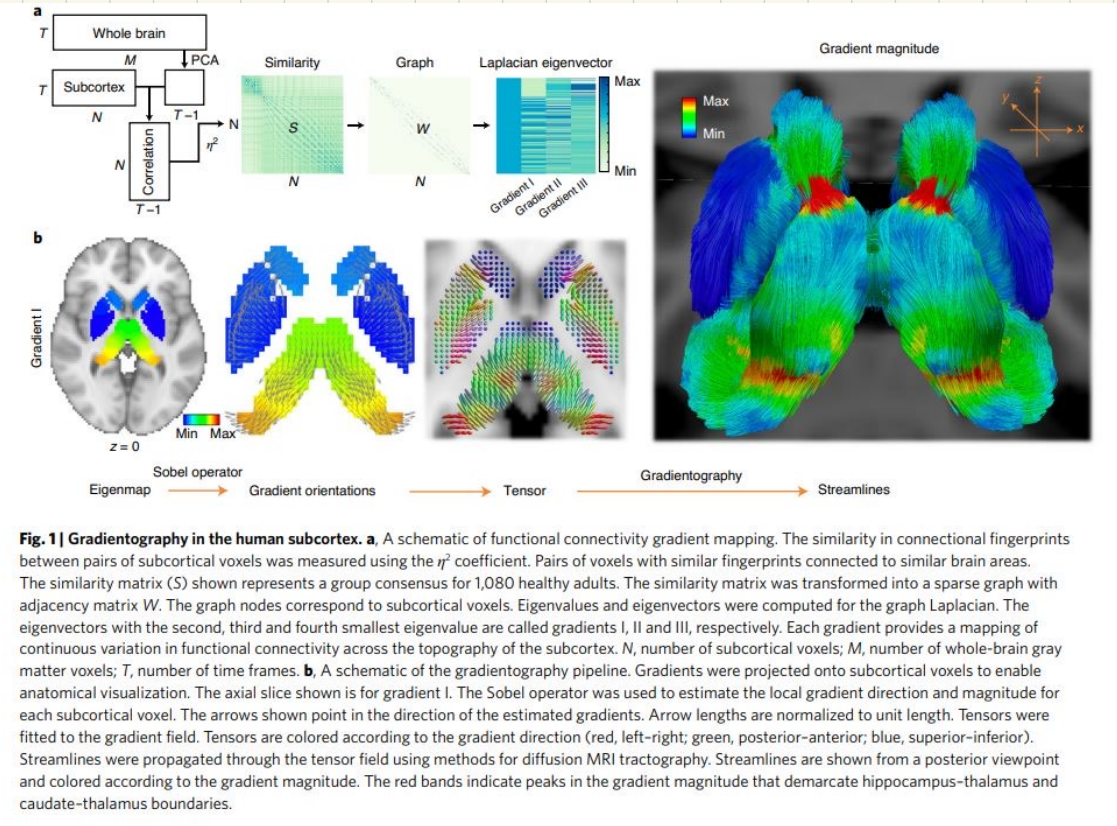
In spectral graph theory one studies the spectrum of a combinatorial extension of the Laplacian concept to a graph.
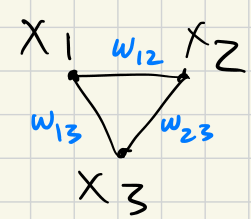
We start with a weighted graph:
- Vertices
- Edges with weights
The adjacency matrix is the matrix for off-diagonal elements, and zeros on the diagonal. (No self-loops.)
The graph Laplacian is the matrix with off-diagonal, and the diagonal entries given as follows:
Then:
Explanation:
For a graph , let
- be the vector space with edges of as basis
- be the vector space with vertices of as basis
Then define
by .
There is an adjoint (transpose) map .
Laplacian eigenmaps process
Let us be given a scale and a target dimension .
Form a weighted graph:
- Vertices
- Edge weights: as follows:
Let and by . The graph Laplacian is .
Consider the matrix with columns given by eigenvectors corresponding to the -largest eigenvalues of . The rows of this matrix define points . Define by assigning
This definition of minimizes the error:
Given the definition of , this error penalizes most strongly nearby points that are sent to distant points .
The Laplacian eigenmaps process does not work well for spheres and other noncontractible spaces that are not covered by a single coordinate chart.
Link to original
UMAP
Introduction
Uniform Manifold Approximation and Prediction
The goal of UMAP is to rebuild the data in a high space as:
Link to original
- Low-dimensional manifold
- The data is first cast as a weighted graph (1-dimensional)
- Uniform sampling assumption
- Dense clusters are spread apart and sparse areas contracted
Theory - UMAP process
UMAP process
We are given a data cloud , and a neighbor-count .
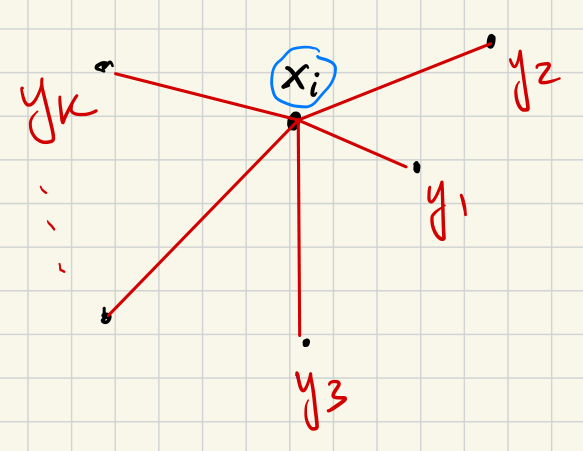
(1) Create weighted partial graphs local to each data point:
For each point , define weights as follows:
- Set .
- All are infinitely far from each other: for .
- For :
- Require that is proportional to ,
- Require that .
That is, the nearest neighbor is placed at distance from , and the other neighbors are made closer to by the distance removed. For each fixed , the collection encodes metric structure of the original data near but with the closest point substituted for .
The weight is supposed to be interpreted as the probability that the point will lie in the same cluster as the point .
From these requirements it is possible to deduce a formula for , as follows:
Set . (Distance to the closest neighbor.) For each , solve for such that:
The idea is that for the closest neighbor , the weight should be the highest; the weight should decrease for neighbors that are farther away.
(2) Glue partial metrics into a single weighted graph:
Now we define a single weighted graph with vertices the points and weights coming from the set of partial graphs defined in Step (1).
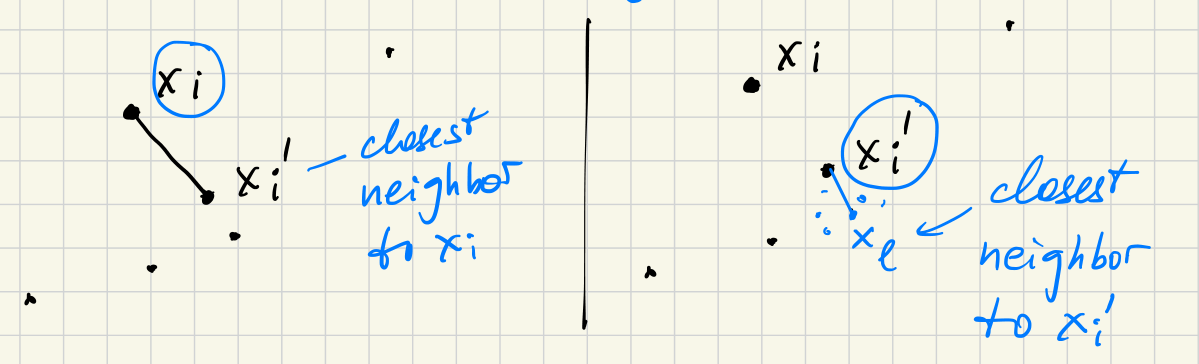
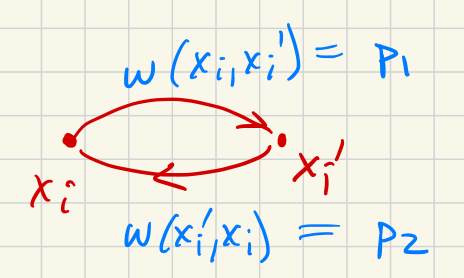
Observe that a given pair of vertices could appear with finite distance in at most two partial graphs. The relation of being “nearest neighbor” is not in general symmetric:
Now, let us be given a pair of vertices .
If this pair appears (with finite weight) in only one partial graph, give the pair a weighted edge in the total graph with the same weight it had in that partial graph.
If this pair appears in two partial graphs, then is the center point in one of them and is the center in the other.
We combine the weights as follows:
- Let
- Let
Then the weight on the pair shall be defined as:
Now we have defined a total weighted graph that combines the information from all the weighted partial (local) graphs.
(3) Embed the total weighted graph in a lower-dimensional space as a weighted graph .
This can be done with standard techniques that we don’t cover here. Briefly:
Start with the spectral graph embedding. Edge weights for edge are in and in . Cross-entropy formula:
Use this cross-entropy as a cost function and perform stochastic gradient descent to minimize the cost.
Link to original
Theory - Gradient descent
Gradient descent
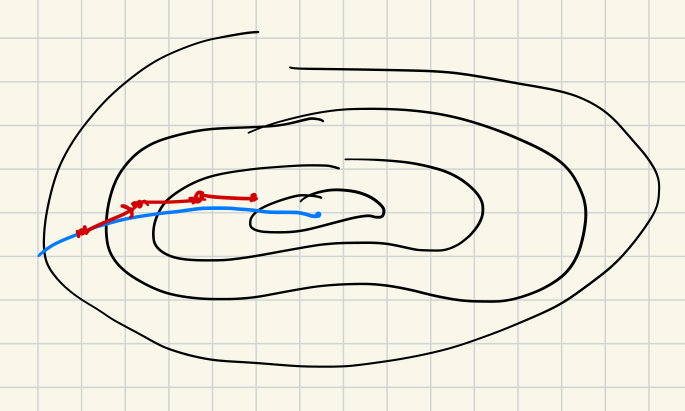
Suppose we are given a cost function .
Given any , the gradient of , written , is the direction of the largest rate of change of .
Smallest rate of change is .
Link to original
Illustration
Illustration - uniform sampling assumption
UMAP is based on an assumption that the data samples uniformly from a manifold.
Link to original
Hausdorff manifolds - a non-Hausdorff example from data
Link to originalHausdorff manifolds?
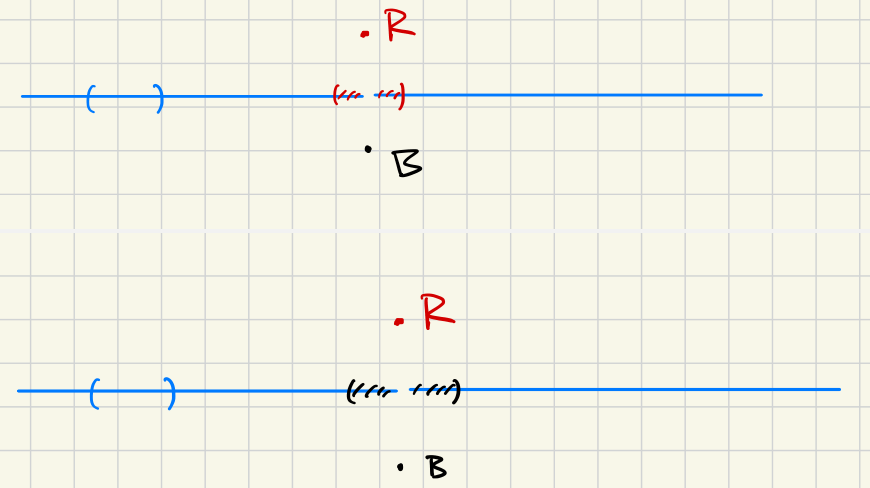
Consider with the standard non-Hausdorff metric:
So the points and cannot be separated by a disjoint neighborhood.
But this can actually happen with data! Suppose flowers come in two colors, red and blue, but the value (lightness) ranges from very dark (black) to very light (white):

Illustration
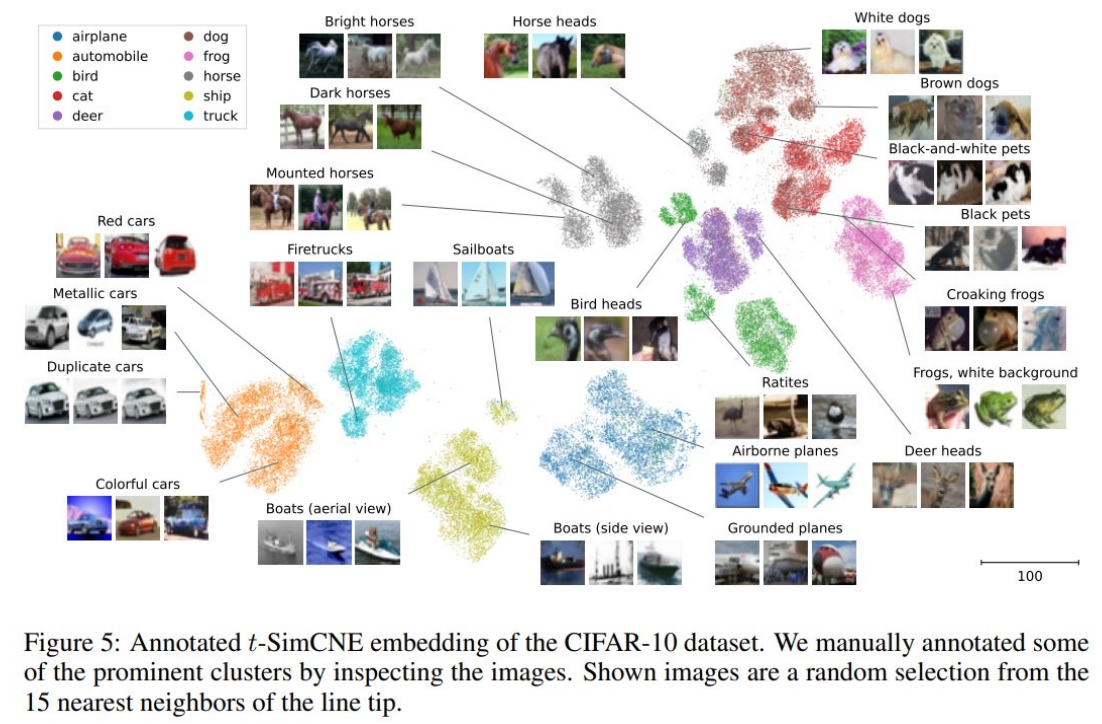
Illustration - UMAP figure from Böhm et al 2022
(Böhm et al. 2022)
Link to original